Dot plots
Understanding dot plotsLook up 'dot plot' and other types of data displays in this online Mathematics dictionary1. Watch Worked example: Dot plots (embedded YouTube video—may require teacher internet login). Construct and interpret dot plotsComplete the student activity at Winning dots2. View on screen or download (.pdf 1.7MB). Complete the dot plot activities (Questions 1–3) in Dot plots and stem-and-leaf plots3. |
Construct or interpret dot plots using this Google Docs. Dot Plots4. (You will need to make a copy of this file using your own Google account. Teachers can also make a copy and assign in Google Classroom.)
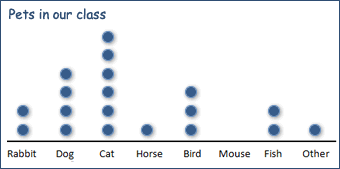
The dot plot below shows the pets owned by a class of students. Complete the Pets dot plot quiz11. |
Links
- https://www.mathsisfun.com/definitions/index.html
- http://nzmaths.co.nz/resource/winning-dots
- https://www.education.com/worksheet/article/stem-and-leaf-plot-1/
- https://docs.google.com/document/d/13pZeqnKbAlSBdNb9Cecqvac3eC_p7oP4MIK8WZdgAic/edit?usp=sharing
- http://nces.ed.gov/nceskids/createagraph/
- https://www.mathgames.com/graphing
- http://www.shodor.org/interactivate/activities/PlopIt/
- https://www.ixl.com/math/grade-3/interpret-pictographs
- https://www.ck12.org/statistics/histograms/lecture/Making-Frequency-Tables-Line-Plots-and-Bar-Graphs/?referrer=concept_details
- https://www.ck12.org/assessment/tools/geometry-tool/plix.html?eId=MAT.STA.103.04&questionId=53e13eb1da2cfe6a5fe14dce&artifactID=1824216&backUrl=https%3A//www.ck12.org/statistics/Histograms/%23interactive&plix_redirect=1
- https://docs.google.com/forms/d/e/1FAIpQLSfC4isPv_DxTJLvEVxgOFRnzpo77ncQCDiDC6uiU3i1uNL0IA/viewform