Dot plot:Solution
How did you go? Check your responses.
Construct dot plots (go to Interpret dot plots)
Interpret dot plots (go to top of page)
| 1 |

The dot plot above shows the pulse rate (beats per minute) after exercise for a group of runners.
- How many runners were observed? 28
- What is the most common pulse rate? 148
- What is the lowest value in the range? 132
- What is the highest pulse rate recorded? 168
|
| 2 |

The dot plot above shows the number of characters typed (per minute) for a group of people.
- How many typists were tested? 13
- What was the fastest speed? 81
- What was the median speed? 66
|
| 3 |

The dot plot above shows how many times a group of students sneezed in 5 minutes.
- How many students were observed? 19
- How many students sneezed more than once? 12
- What is the highest value in the range? 10
- What is the lowest value in the range? 0
|
| 4 |

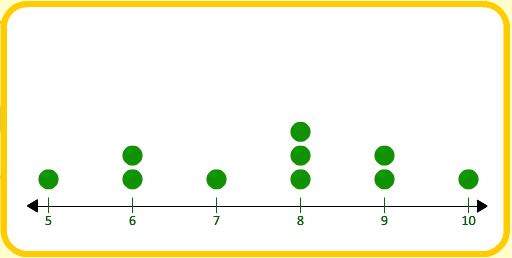
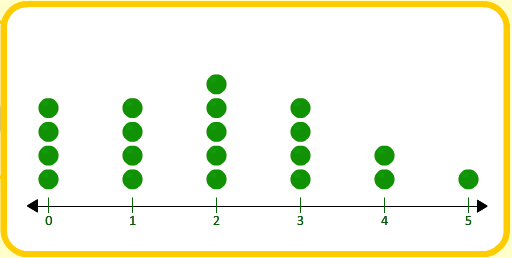
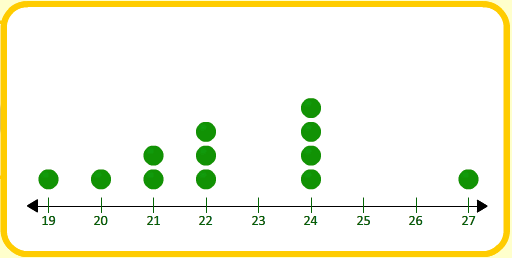
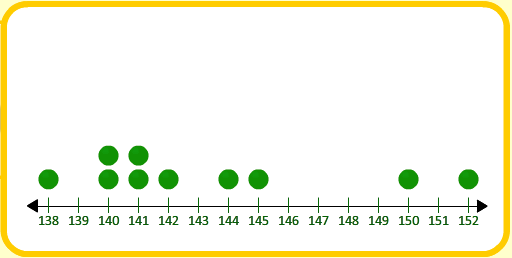
The dot plot above shows the marks achieved by a class in a test.
- How many students were tested? 22
- How many students achieved the highest score? 3
- What is the lowest value in the range? 0
- If 5 is a pass, how many students passed the test? 19
|
| 5 |

The dot plot above shows the results of a survey that asked: How many people are in your family?
- How many people responded to the survey? 1
- What is the most common family size? 4
- How many people belong to a family of 3? 3
- What size is the largest family? 9
|
Top of page
