Dot plots
Instructions
Construct dot plots and interpret dot plots by completing the activities below. Use a blank sheet of paper to record your answers or print this page.
When you have completed all activities, click on the 'Solution' link at the bottom of the page to check your answers.
Construct dot plots
Read the survey description and the data collected. When you are ready to start, draw the number line for the dot plot based the data range (from the lowest to highest number). Construct the dot plot by adding dots according to the data in the survey.
| 1 | A group of 10 children at a pantomine concert were asked how old they are. Below are their responses: Graph the data on a dot plot.
|
|---|---|
| 2 | 20 children were asked how many pets they had at home. Here are their responses: Graph the data on a dot plot.
|
| 3 | 12 teachers were asked the number of students in their class. Here are their responses: 22, 24, 20, 27, 24, 24, 19, 21, 22, 21, 22, 24 Graph the data on a dot plot.
|
| 4 | A teacher measured the height of students in her class. Here are the measurements in centimetres: Graph the data on a dot plot.
|
| 5 | A trainer recorded the time an athlete took to run 200 metres during training. Here are the times (in seconds): Graph the data on a dot plot.
|
Interpret dot plots
Read the survey description and study the dot plot of the survey data. When you are ready, answer each of the questions about the dot plot.
| 1 |
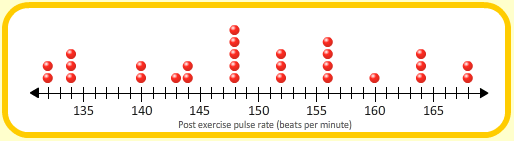
The dot plot above shows the pulse rate (beats per minute) after exercise for a group of runners.
|
|---|---|
| 2 |
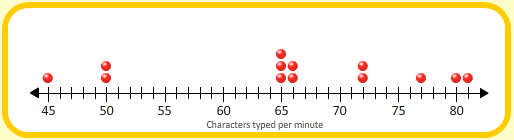
The dot plot above shows the number of characters typed (per minute) for a group of people.
|
| 3 |
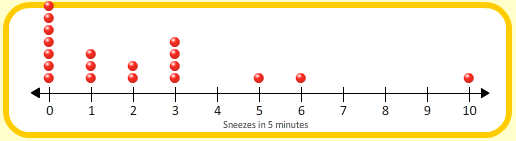
The dot plot above shows how many times a group of students sneezed in 5 minutes.
|
| 4 |
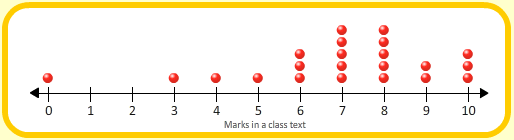
The dot plot above shows the marks achieved by a class in a test.
|
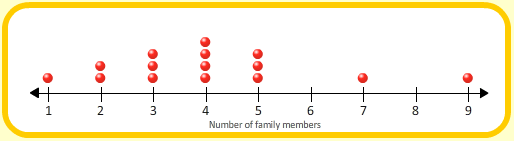
| 5 |
The dot plot above shows the results of a survey that asked: How many people in your family?
|