About
As you study geography, you will use the following geographical tools throughout the inquiry process:

The K–10 geographical tools continuum1 lists tools that are appropriate for each stage of learning.
Explore each of the tools below for examples, definitions and applications in geography K–10.
Maps
Maps are one of the geographer’s main tools. They show the location of places and features, and spatial patterns and distribution.
Use a variety of types of maps to acquire, represent and communicate geographical information.
Click on each of the following map types to view more information.
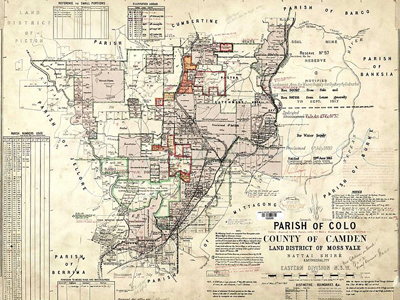
A cadastral map shows property boundaries. Cadastral maps from varying time periods can be analysed for changing land uses and settlement patterns.
The State Library of NSW has an extensive maps collection3, including a comprehensive collection of subdivision plans.
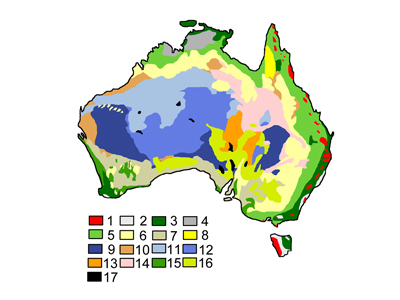
A choropleth map is a thematic map that uses colours or shading to represent areas with the same characteristics such as land use, vegetation types, climate zones or population density.
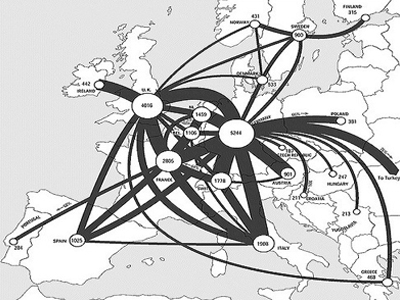
A flowline map uses arrows to show the flows of people, goods, information or ideas between places. The thickness of the line represents the volume of flow.
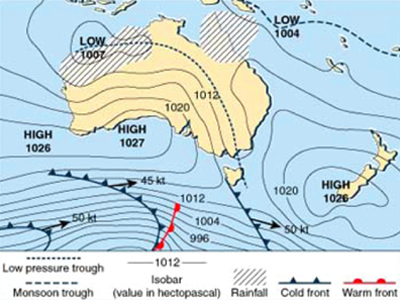
An isoline map has continuous lines (called isolines) that join points of the same value, such as rainfall and elevation.
Other examples of maps that use isolines are synoptic charts (such as the one shown here) and topographic maps.
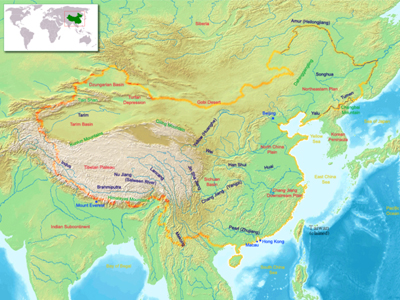
Physical maps illustrate the physical features and landforms of an area such as lakes, mountains, rivers and coasts.
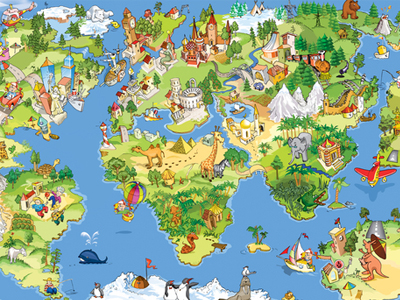
A pictorial map uses illustrations to represent information. They are often used for tourist maps and represent either an oblique or bird’s-eye view.
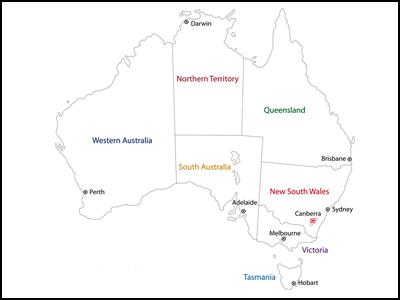
Political maps illustrate state and national boundaries, capital cities and major cities.
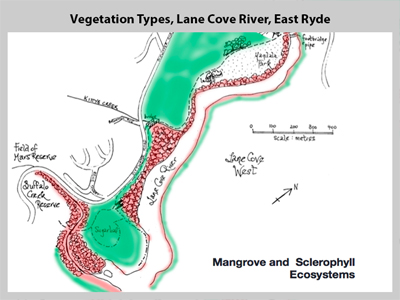
A précis map is a simple sketch map drawn from a photograph or topographic map. It usually focuses on one feature, for example, vegetation cover.
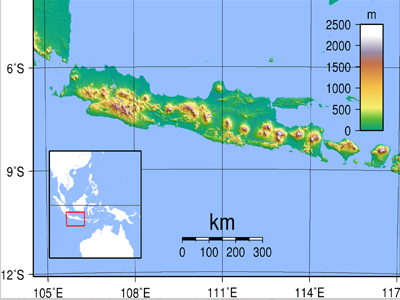
A relief map is either a 2D or 3D map representing terrain and landforms, such as the shape of the land.
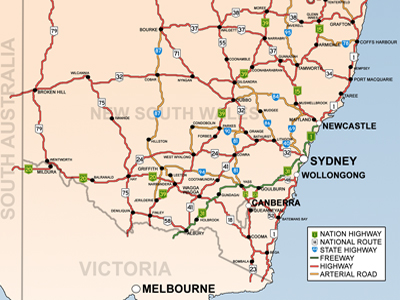
A road map shows roads and transport links at large scale (such as a street directory) or small scale (such as state highways).
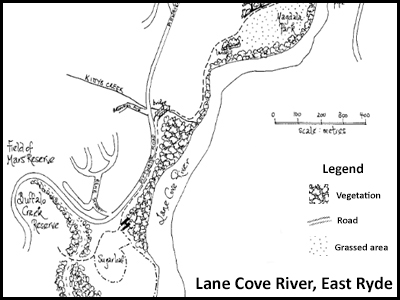
A sketch map is a drawing of the study area from a bird’s-eye view. It can be estimated or to scale. A sketch map provides a simple visual description of an area and maps the main natural and human features. It should include a border, title and a legend.
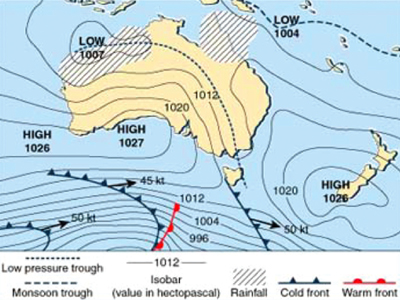
Synoptic charts are weather maps. They are isoline maps that show the atmospheric conditions of a location at a particular time including rainfall, air pressure (atmospheric pressure), wind speed and wind direction.
The Australian Bureau of Meteorology website has four-day forecast synoptic charts12. See GeogSpace: Weather Maps13 for information about how to read a weather map.
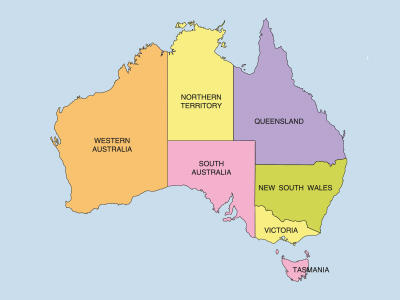
Thematic maps are based on a particular theme or topic, such as distribution of resources, weather or vegetation type.
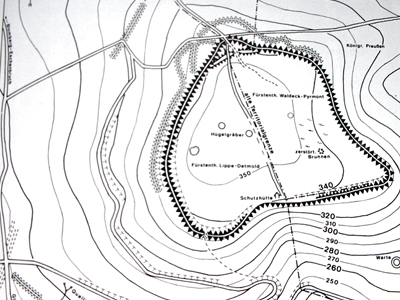
Topographic maps are large scale maps which show a small area in large detail.
They use contour lines to show the shape of the land as well as important natural and human features such as landforms, vegetation and roads.
Maps show the Earth’s surface in varying amounts of detail, depending on their scale.
Large scale maps
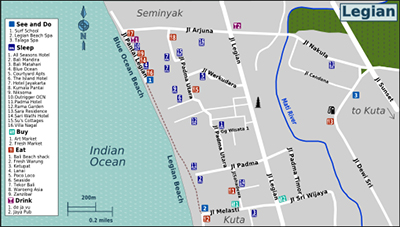
Large scale maps show a small area in large detail. Examples of large scale maps include topographic maps, school site maps, national park maps and tourist information maps. On a large scale map 1 centimetre might represent 500 metres (1:50 000).
Small scale maps
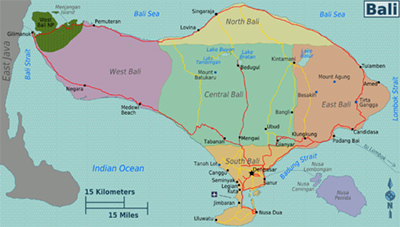
Small scale maps show a large area in small detail. Examples include maps of the world and maps of states and countries. On a small scale map 1 centimetre might represent 1000 kilometres (1:100 000 000).
In learning to use and construct maps, follow standard cartographic conventions.
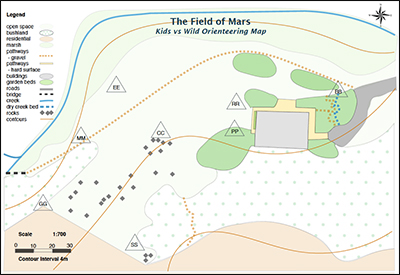
Every good map should have a:
-
Border
-
Orientation (north point)
-
Legend (key)
-
Title
-
Scale.
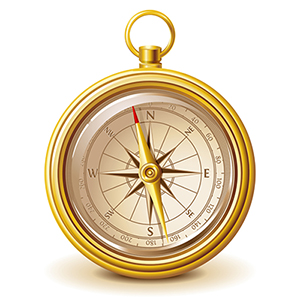
The following phrase for the acronym NESW (North, East, South, West) can be used to remember compass points:
-
Never
-
Eat
-
Soggy
-
Weetbix.
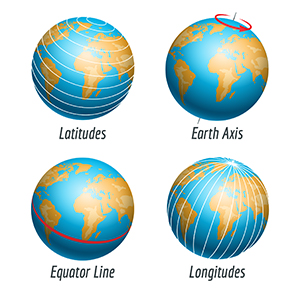
Lines of latitude and longitude are imaginary lines that allow us to find locations on small scale maps.
Lines of latitude (think ‘flat’):
-
run horizontally
-
run parallel to each other
-
are measured in degrees north or south of the equator
-
begin from the Equator at 0o
-
are quoted first.
Lines of longitude (think ‘long’):
-
run vertically
-
run from the North Pole to the South Pole
-
are known as meridians
-
are measured in degrees east or west of the Prime Meridian (Greenwich) at 0o
-
are quoted second.
Grid references and area references
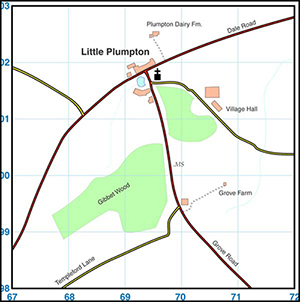
Grid lines are used to locate a feature on a map.
-
Vertical grid lines are ‘eastings’ because they increase in number value as we look to the east.
-
Horizontal grid lines are ‘northings’ because they increase in number value as we look to the north.
-
Eastings are quoted before northings. (Think ‘E’ comes before ‘N’ in the alphabet.)
Area references
These have four digits and are used to find the area containing a feature. The first two digits are the easting. For example,
the area reference for Little Plumpton is 6901 – an easting of 69 and a northing of 01. The area reference always refers to
the bottom left hand corner of the grid square.
Grid references
These have six digits and are used to pinpoint the exact location of a feature. The first three digits are the easting.
For example, the grid reference for the church in Little Plumpton is 696017. The numbers that make up this grid reference are formed in the following way:
-
69 is the easting
-
6 is obtained from dividing the area reference square into a 10x10 grid and giving the easting number from 1-10 which refers to the line to be followed
-
01 is the northing
-
7 is obtained from dividing the area reference square into a 10x10 grid and giving the northing number from 1-10 which refers to the line to be followed.
Fieldwork
Fieldwork is integral and essential to the study of geography. It is mandatory for all students K–10.
Fieldwork involves working outside the classroom to observe, measure, collect and record geographical information.
The experience should be fun, engaging and age appropriate.
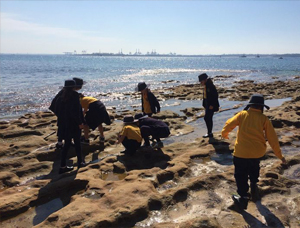
During fieldwork you will:
-
be immersed in a variety of real-world environments
-
be actively engaged in geographical inquiry
-
investigate geographical phenomena in an authentic learning context
-
learn through a variety of teaching and learning approaches
-
use a wide range of geographical tools
-
explore geographical processes within environments
-
locate, collect and record primary data and information
-
explore varying perspectives on geographical issues.
Students must undertake and participate in fieldwork in each stage of learning.
BOSTES, 2015, Geography K–10 Syllabus - Geographical Tools20
Fieldwork sites
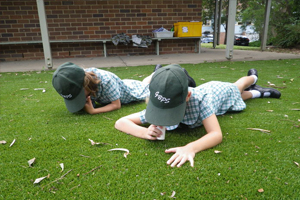
Fieldwork can be undertaken at school, in the local area or at more distant places. Experiences can range from a part of a lesson, to an overseas cultural study tour.
Fieldwork sites can include:
-
school grounds
-
local neighbourhood
-
local natural areas
-
national parks or reserves
-
beaches, estuaries, wetlands
-
agricultural areas
-
towns and cities.
Environmental and zoo education centres
There are 25 DoE Environmental and Zoo Education Centres21 (EZEC) in NSW providing geography fieldwork experiences. The centres have specialist measuring and recording equipment and
teachers with expertise in fieldwork skills, tools and techniques.
Aboriginal or Torres Strait Islander sites
When proposing fieldwork for Aboriginal or Torres Strait Islander sites, consult with local communities and your local Aboriginal Education Consultative Group22 (AECG). Students, teachers and accompanying parents and carers need to be familiar with protocols for visiting the site and working with Aboriginal communities.
Further information for teachers
-
Refer to GeogSpace: Selecting a fieldwork23 site for potential fieldwork sites and activities for each stage.
-
Refer to Working with Aboriginal Communities: A Guide to Community Consultation and Protocols24 from BOSTES.
Fieldwork tools and techniques
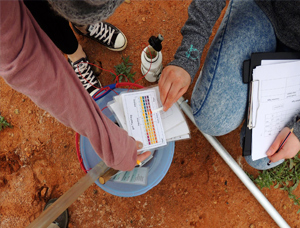
Fieldwork activities and the tools used should be carefully planned to maximise understandings achieved through direct observation,
measurements and recording. The tools and techniques should be stage appropriate and enjoyable.
Activities can include:
-
recording observations through sketches and photographs
-
measuring distances, temperature, humidity, wind speed, gradient
-
testing soil pH, water quality, turbidity
-
counting plants using quadrats and along a transect
-
collecting aquatic and terrestrial invertebrates as bioindicators
-
estimating cloud cover, vegetation type, canopy cover
-
plotting location, natural and human features on maps
-
calculating bearings, direction and aspect using a compass
-
interviewing family, community, stakeholders for varying perspectives
-
surveying people to obtain quantitative data.
Graphs and statistics
Geographers use graphs to visualise and summarise quantitative data about places. Examples include tally charts, pictographs, column graphs, line graphs, pie graphs and climate graphs. Always include the unit of measurement when reading data from graphs – for example, temperature in degrees Celsius or rainfall in millilitres.
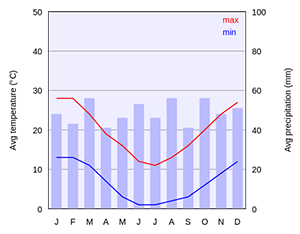
For a particular location, a climate graph combines:
-
a line graph showing the average monthly temperature
-
a column graph showing the average monthly precipitation (rainfall).
Teachers: Refer to GeogSpace: Climate graphs13 for information on using and analysing climate graphs and statistics.
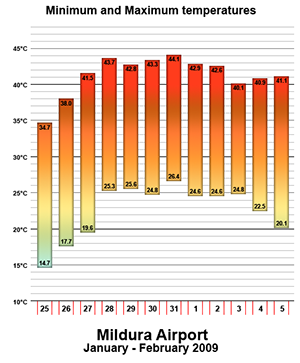
Geographers use statistics to collate, organise and summarise geographical data and information. In particular, climate and demographic statistics are useful data. Geographers analyse statistics for patterns, relationships and trends.
Teachers: Refer to GeogSpace: Comparative data27 for an example of a comparative data table.
Useful sources of statistical data include:
-
Australian Bureau of Statistics28 (ABS)
Spatial technologies
Geographers use spatial technologies to visualise, manipulate, analyse, display and record spatial data. Examples include virtual maps, satellite imagery, remote sensing, Global Positioning Systems (GPS), Global Information Systems (GIS) and Augmented Reality (AR).
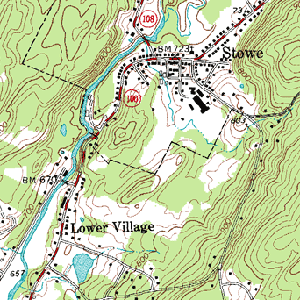
Virtual maps are online maps. They provide large scale and small scale maps for acquiring geographical information for students in all stages. They can be annotated using in-built tools or by using a screenshot as the base map. Interactive virtual maps usually contain a map view and a satellite view.
View an example of how Google My Maps31 is used to locate and describe the Illawarra EEC fieldwork sites32. Also view an example of a précis map created in My Maps for a Field of Mars EEC fieldwork program33.
Useful virtual maps and tools:
-
Whereis 37
Basic GPS and GIS are now a familiar part of life. Think of using a phone or car navigation device, tracking a food or parcel delivery or locating a lost mobile phone.
Useful GIS maps and tools:
-
SIX Maps42 (includes 1943 aerial photography of greater Sydney)
-
SpatialGenie43 (includes colonial maps of Sydney and other Australian information)
-
Eyes on the Forest45 (Sumatra’s forests, wildlife and climate 1985 to the present).
GPS – Global Positioning System
GPS is a navigational system that relies on satellite signals to provide location and time information. GPS technology is integrated into mobile phones, car navigation and handheld GPS devices. Each GPS device collects spatial data and plots it onto a base map. The digital plotting of spatial data to create visual images is a GIS (Global Information System).
Geocaching is an outdoor treasure hunt that requires a GPS enabled device to locate hidden items. Geocaching can provide an engaging method for undertaking geographical fieldwork. For example, each geocache could contain geographical questions to answer and data to collect.
GIS – Global Information System
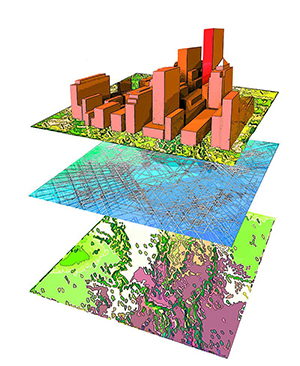
A GIS stores, manages, analyses and portrays spatial data. Sophisticated GIS maps have multiple layers of information generated by computer programs.
GIS maps are a valuable tool for geographers, as they:
-
are a source of geographical information. For example, landforms, vegetation, land use
-
can be used for analysing spatial data. For example, transposing mapping layers, measuring distances
-
can communicate spatial data. For example, plotting fieldwork data, creating a tour.
Remote sensing includes the use of satellites, drones, aircraft and radars to collect geographical information remotely (that is, from a different location to the information itself). Satellite images are created through remote sensing.
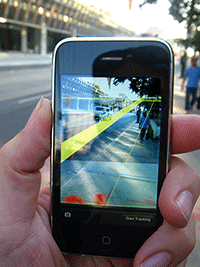
Augmented Reality (AR) is a computer-generated virtual view superimposed on to a physical real world environment. Sound, video, graphics or GPS data are added to augment (supplement) the experience.
Augmented Reality in geography includes using a GPS device to scan environmental features and trigger supplementary information received in the form of images, video or text.
Visual representations
Geographers use visual representations in all steps of the geographical inquiry process. Examples include diagrams, paintings, illustrations, symbols, models, collages, cartoons, multimedia and mindmaps.
Geographers can use graphic organisers to represent, organise, evaluate and analyse information in the processing step of
a geographical inquiry.
Examples of graphic organisers:
-
KWL chart (know, want to know/wonder, learnt), PMI chart (plus, minus, interesting), PNQ chart (positive, negative, question)
-
consequences chart
-
development compass rose
-
diamond and fishbone ranking
-
flowchart
-
futures line and wheel
-
placement proforma
-
T and Y chart
-
Venn diagram
-
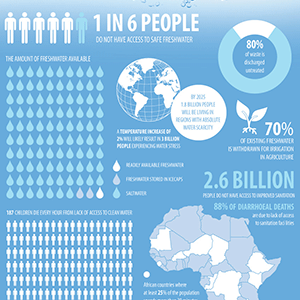
Infographic - a tool that explains data in visual form by combining a large amount of information clearly in visual mode. Infographics can be used both to acquire and communicate information.
Templates of graphic organisers are available on the Global Education Templates49 page.
Photographs, field sketches and photo sketches enable geographers to record and label observations of features of places. They are valuable tools in describing geographical characteristics.
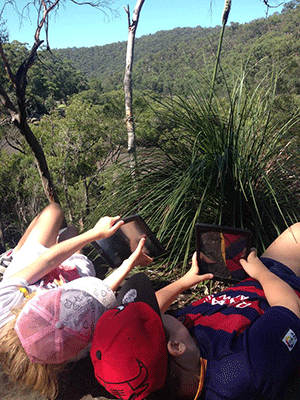
Photographs can be used for different purposes and are one of the most useful tools for geographers.
Photographs can:
-
record observations during fieldwork
-
provide information varying from ground details to land-use patterns over large areas
-
be annotated with labels and descriptions
-
be categorised and collated into annotated collages
-
add a visual element to tables, flowcharts and other graphic organisers
-
be sequenced into simple slideshows with narration
-
be embedded into multimodal texts and presentations.
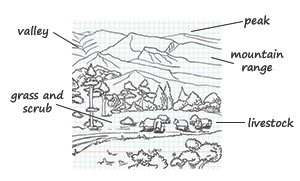
A field sketch is a labelled line drawing of an environment that records features observed during fieldwork activities. Apps are available to annotate photographs taken in the field, however completing a hand-drawn field sketch sharpens the viewer’s observational skills.
Refer to Field sketching: Teacher notes50 from GeogSpace for instructions or view an example sketch in Photo sketching: Teacher notes50.
Photo sketches or line drawings
A photo sketch is made from a photograph. It can also be called a line drawing. Photo sketching is a useful tool for virtual fieldwork.
Read Photo sketching: Teacher notes50 for instructions and examples of photo sketches.
Tip: Google Street View40 can provide virtual fieldwork. Street view screenshots can be used for photo sketches.

Picture books are a useful geographical tool, as they:
-
engage students in the learning
-
introduce geographical concepts and contexts
-
provide visual images of people and places
-
use narrative to breathe life into places
-
illustrate interconnections between people and places
-
explore complex cultural issues
-
provide a variety of perspectives.
Download Picture books to support the teaching of geography K–10 (.docx 39kB).
Links
- https://syllabus.bostes.nsw.edu.au/hsie/geography-k10/continuum-of-tools/
- https://commons.wikimedia.org/wiki/File:Colo_Parish_NSW.jpg
- http://guides.sl.nsw.gov.au/content.php?pid=184734&sid=5594635
- https://en.wikipedia.org/wiki/Forests_of_Australia#/media/File:Australian_Vegetation.png
- https://creativecommons.org/licenses/by-sa/3.0/
- https://flic.kr/p/7FUxoY
- https://creativecommons.org/licenses/by-nc/2.0/
- https://commons.wikimedia.org/wiki/Atlas_of_the_People%27s_Republic_of_China#/media/File:ChinaGeography.png
- https://upload.wikimedia.org/wikipedia/commons/b/b4/Java_Locator_Topography.png
- https://en.wikipedia.org/wiki/List_of_road_routes_in_New_South_Wales#/media/File:Map_of_NSW_Highways.png
- https://creativecommons.org/licenses/by/3.0/
- http://www.bom.gov.au/australia/charts/4day_col.shtml
- http://www.geogspace.edu.au/core-units/years-7-8/inquiry-and-skills/years-7-8/y78-is-illus1.html
- https://commons.wikimedia.org/wiki/File:Herlingsburg.png
- https://creativecommons.org/licenses/by-sa/3.0/deed.en
- https://commons.wikimedia.org/wiki/File:Bali-Legian-Large-Scale-Map.svg
- https://creativecommons.org/licenses/by/3.0/deed.en
- https://commons.wikimedia.org/wiki/File:Bali_regions_map.png
- https://en.wikipedia.org/wiki/Grid_reference
- http://syllabus.bostes.nsw.edu.au/hsie/geography-k10/geographical-tools/
- http://guides.education.nsw.gov.au/ezec
- https://www.aecg.nsw.edu.au/
- http://www.geogspace.edu.au/support-units/fieldwork/fi-illustration1.html
- http://ab-ed.bostes.nsw.edu.au/go/partnerships
- https://commons.wikimedia.org/wiki/File:Climate_chart_of_Canberra.svg
- https://commons.wikimedia.org/wiki/File:Mildura_Heatwave_Min_%26_Max_Temps_09_(Concept).png
- http://www.geogspace.edu.au/core-units/years-5-6/exemplars/year-6/y5-exemplars-y6-illus2.html
- http://www.abs.gov.au/
- http://who.int/countries/en/
- https://commons.wikimedia.org/wiki/File:Topographic_map_example.png
- https://www.google.com/maps/d/?hl=en_US&app=mp
- https://www.google.com/maps/d/viewer?mid=zud7EHgH96sY.kyD6Bc3ao_lc
- https://www.google.com/maps/d/viewer?msa=0&mid=zbg96sUsoJt4.khKfR-1Pob4Y
- https://www.google.com.au/maps
- https://www.google.com/earth/
- http://www.bing.com/maps/
- http://www.whereis.com/
- https://en.wikipedia.org/wiki/UNSW_School_of_Surveying_and_Geospatial_Engineering#/media/File:Layers_of_information_lolly.jpg
- https://tourbuilder.withgoogle.com/
- https://www.google.com.au/intl/en-GB/maps/streetview/
- http://scribblemaps.com/
- https://maps.six.nsw.gov.au/
- http://www.spatialgenie.edu.au/spatialgenie/
- http://mapmaker.nationalgeographic.org/
- http://maps.eyesontheforest.or.id/
- https://en.wikipedia.org/wiki/Augmented_reality#/media/File:MediatedReality_on_iPhone2009_07_13_21_33_39.jpg
- https://www.flickr.com/photos/gdsdigital/4462056279/
- https://creativecommons.org/licenses/by/2.0/
- http://www.globaleducation.edu.au/resources-gallery/resource-gallery-templates.html
- http://www.geogspace.edu.au/core-units/f-4/inquiry-and-skills/year-f-4/yf4-is-illus2.html