A recent discovery
Explore diagrams with more than 3 attributes
We have explored Venn diagrams with 2 and 3 attributes. What happens when there are more?
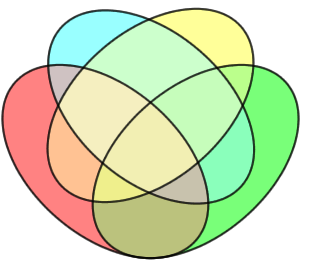
Check out this Venn diagram with 4 attributes. Mouse over the diagram to see the region labels.

|
Can you see which regions represent:
|
Look at how complex this Venn diagram is. It has 7 attributes.
-
Drag your mouse to flip it over.
-
Roll your mouse over it to see what each region represents.
If your browser is unable to display the interactive Venn diagram above, view one or more of these alternative images:
You can see that as we include more attributes, the Venn diagrams can become quite complex and messy. So you can imagine how excited mathematicians Khalegh Mamakani and Frank Ruskey were when, in 2012, they discovered a symmetric Venn diagram with 11 attributes!