Geographical tools (accessible version)
Slide 1: Introduction
There are no introductory notes for this slide show.
Slide 2: Geographical tools, geographical skills
Geographical tools:
-
maps
-
fieldwork
-
graphs and statistics
-
spatial technologies
-
visual presentations.
Geographical skills:
-
acquiring information
-
processing geographical information
-
communicating geographical information.
The geography syllabus identifies and describes specific geographical tools. These tools are integral to the process of geographical inquiry, described in detail in the syllabus’s ‘Geographical inquiry skills’.
Tools and skills are scoped in continuums of learning, with a description of the tools and skills provided for each stage.
For teachers who are new to teaching geography (K–10), the use of geographical tools to collect data and information will require some professional development.
The use of these geographical tools is engaging and fun for students while supporting their learning.
Slide 3: Sources of data and information
Primary data and information
Original materials collected by someone, for example, field notes, measurements, recorded observations, photos, responses to a survey or questionnaire.
If you gather or create it yourself it is primary data.
Secondary data and information
Have been collected, processed, interpreted and published by others, for example, census data, newspaper articles, web pages and images or information in a published report.
Geographical inquiry relies on locating, collecting, gathering and recording geographical data and information.
Geographical tools are used to collect and organise both primary and secondary data and information.
Primary data and information is collected first hand, while secondary data and information has been collected and sorted by others.
All data and information referenced is in response to the geographical questions that have been posed about a geographical issue or problem.
There will be some variation in the way teachers refer to primary and secondary data and information. What matters to students is that these terms are used consistently by their teacher.
Slide 4: Maps and mapping
Map basics:
-
border
-
orientation
-
legend
-
title
-
scale
-
direction
-
distance
-
latitude
-
longitude.
Types of maps:
-
pictorial
-
choropleth
-
isoline
-
weather/synoptic
-
political
-
flowline
-
topographic.
Teaching map basics and using a variety of maps in context has a place in every geography classroom.
Using maps and mapping skills is fundamental to the study of places. Use a range of scales and a wide variety of map types to suit various purposes.
Many students find maps fascinating and with the increasing use of spatial technologies access to and use of maps have also increased.
The need to use language related to place and space is an important aspect of maps and mapping skills.
Slide 5: Geographical fieldwork K–10
Geographical fieldwork:
-
is an integral and mandatory part of geography K–10
-
facilitates an understanding of geographical concepts and inquiry
-
should link to geography syllabus outcomes and content.
Refer to the geographical tools continuum for stage examples of fieldwork.
Explore Fieldwork techniques for information and instructions relating to a range of inspiring and innovative fieldwork techniques.
Slide 6: Fieldwork
Investigate the natural and/or human features of a place.
-
Use a compass to determine direction of places.
-
Use GPS to determine latitude, longitude and altitude of places.
-
Measure distance travelled using a pedometer, trundle wheel, GPS.
-
Collect samples, for example of soils and plants.
-
Measure air and water body temperatures using a thermometer.
-
Observe and record cloud cover, use a grid to determine coverage and cloud chart to determine cloud type.
-
Observe and record the features of places or things, such as plants, trees, buildings, streets.
-
Look and listen for evidence of wildlife.
-
Observe and record the land-use features along a street.
-
Construct a transect to show change over distance.
-
Do a tally of an identified action, such as passing trucks, transport modes, aircraft overhead.
Fieldwork needs to link to syllabus content.
Use accessible locations such as the school grounds, local streets, shopping or commercial centre, a nearby park, recreation ground or national park. An excursion or incursion with your local Environmental Education Centre is a way to add value to the collection of data and student engagement with fieldwork.
The use of spatial technologies will have an increasing role in the acquisition of fieldwork data, such as students using GIS in the field or filming the features in a transect.
Fieldwork can be extended by collaborating with students in a different location. Students can plan, undertake, then share and compare the data and information collected for their different sites.
Slide 7: Graphs and statistics
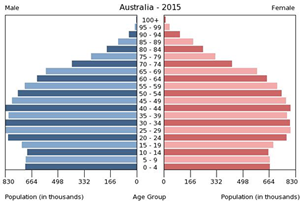
Geographers use a variety of statistical data and graphs.
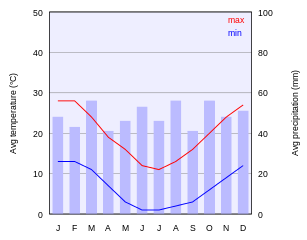
Climate graphs visualise and summarise the climate of places.
A climate graph can show:
-
wettest/driest months
-
hottest/coldest months
-
seasons
-
hemisphere
-
temperature range
-
average annual rainfall.


Statistics can be collected by students in the ‘Acquire data and information’ component of the geographical inquiry. With planning, specific data can be collected as part of science or mathematics learning. This data can then be utilised in a geographical inquiry. For example, the data could relate to weather, population demographics, transport, land-use, flora and fauna counts and water usage.
Data is recorded into a format that is age and stage appropriate and can include databases and spreadsheets. Once the data is recorded, a variety of graphical representations can be developed to provide a way of interpreting for patterns and trends that add value to the raw statistics.
Slide 8: Spatial technologies
Purpose:
-
sources of geographical information
-
presents geographical data
-
supports environmental management, disaster relief
-
a growing career option.
Includes:
-
virtual maps
-
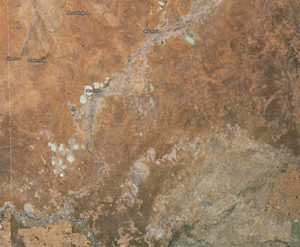
satellite images
-
global positioning systems (GPS).
GPS in the classroom:
-
geocaching
-
National Geographic MapMaker interactive
-
Google Tour Builder.

Probably without even knowing it you are familiar with spatial technologies, which are crucial for our modern world. The spatial industry is booming and spatial tools are now more likely to be found on a smartphone or personal computer than in a specialist laboratory.
Spatial information is the digital connection between location, people and activities. This information can graphically illustrate what is happening (where, how and why) to show the insight and impact of the past, the present and the (likely) future. The knowledge produced by spatial information is fundamental to the lives of every Australian.
To be considered ‘spatially literate’, an individual must have the ability to capture and communicate knowledge in the form of a map, to understand and recognise the world as view from above, to recognise and interpret patterns, and to comprehend such basic concepts as scale, projection and spatial resolution. Goodchild (2006)
Spatial technology is the use of data and mapping to create digital products that can be used in areas such as business, education and disaster response management. Spatial technologies include any form of technology that refers to place, space and location. Specifically, they are technologies that organise and collect data by referencing the information collected to a point on the earth’s surface using latitude and longitude. A very large percentage of all information gathered today has a spatial or geographical component. This means most information is tied to a place. This includes the following.
-
Remote sensing, the science and art of obtaining information about the Earth’s surface without being in contact with it.
-
Global positioning systems (GPS), a satellite-based navigation technology that uses a network of orbiting satellites to determine locations on earth.
-
Geographic information systems (GIS), a computer-based mapping software that collects, stores and analyses previously unrelated information into easily understood maps. Data is represented as layers of information (called themes) which can be turned on or off according to what the user wants to look at and the relationships they are trying to find.
The spatial information industry is a component of the broader information technology sector and has scientific and technical links to all other disciplines such as environmental science, engineering, computer science, health delivery, logistics, planning, resource management and electronics.
Slide 9: Visual representations
Visual representations include:
-
photographs
-
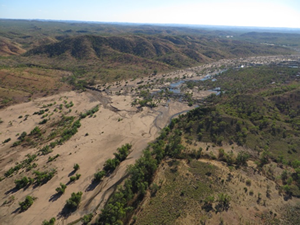
aerial photographs
-
illustrations
-
flow diagrams
-
annotated diagrams
-
multimedia
-
web tools.

© G. Braiding
A variety of visual representations add value to geographical inquiries.
The old adage ‘a picture tells a thousand words’ could not be more true than in the study of people and places at a variety of scales.
Accessing real time webcams (nationally and internationally) also adds to the role of visual representations in the geography classroom. These can be used to collect a range of raw data and information.
Illustrations, and annotated and flow diagrams assist in understanding information about the specific geographical issue or problem being investigated.