Investigating with Microsoft Math

Investigating with GeoGebra

This task continues the investigation of straight lines using GeoGebra.

Take relevant screen shots and make some notes in a presentation or note-taking software as you complete the following questions.
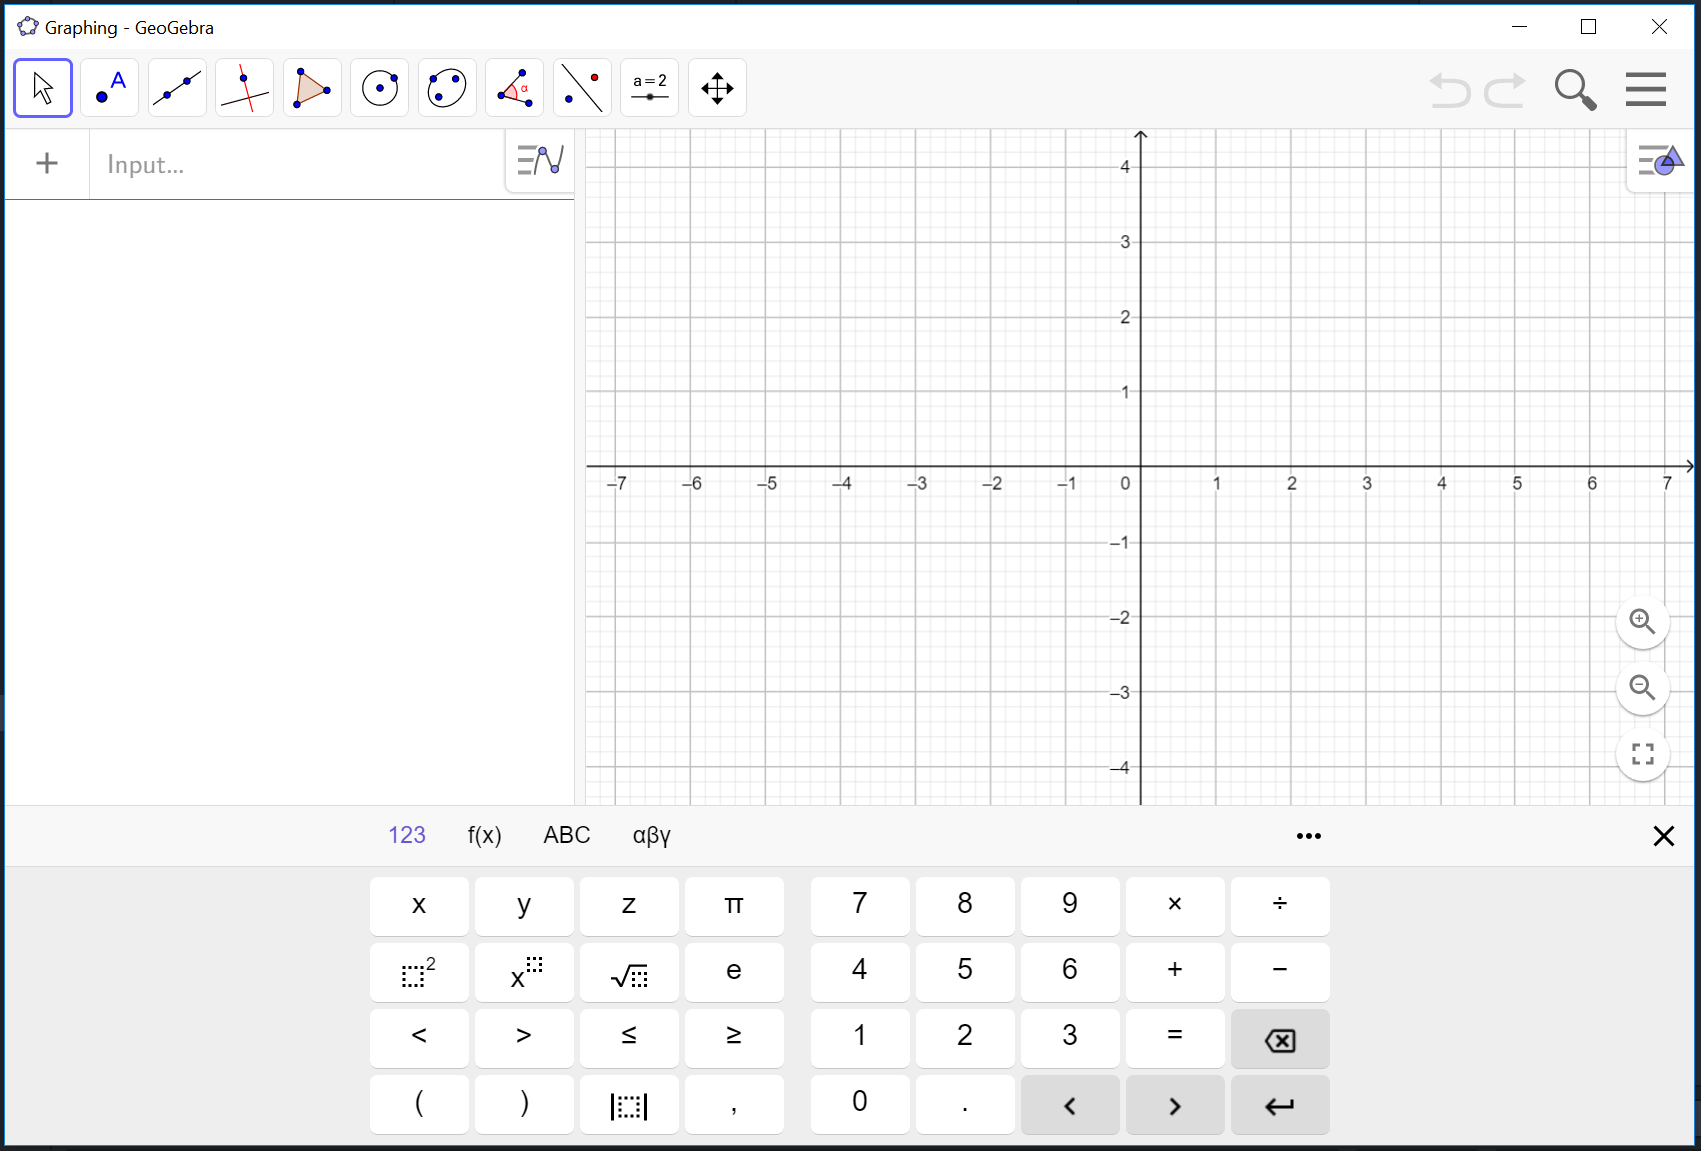
  1. Open GeoGebra and select Graphing mode. There are tutorials available through the software.

  2. Graph y = mx + b by typing that into the Algebra input bar. This will give you the option of creating sliders for both m and b.

  3. Animate b from -5 to 5.

  4. What happens to the graph when b = -3, b = 0 and b = +3?

  5. Write a description explaining what happens to the graph of y = mx + b when b is varied.

  1. Now animate m from -5 to 5.

  2. What happens to the graph when m = -3, m = 0 and m = +3?

  3. Write a description explaining what happens to the graph of y = mx + b when m is varied.

  1. Graph y = -4x + 3 on the same axis.

  2. Use the sliders to adjust the first line. What are the values of m and b when the graphs become the same line?

  1. Now set the controls so that the two lines are parallel.

  2. What are m and b when the lines are parallel? Is there more than one correct answer?

  3. Write a paragraph explaining the requirements on y = mx + b for two lines to be parallel.

  1. Now set the controls so that the two lines appear to be perpendicular.

  2. What are m and b when the lines appear to be perpendicular? Is there more than one correct answer?

  3. Write a paragraph explaining the requirements on y = mx + b for two lines to be perpendicular.

Publish your final notes as a .pdf titled “Investigating straight lines”. You could email them to an absent classmate and/or save them for future reference. Your teacher will want to see them too!