Smartphones
Complete two-way tables based on a Venn diagram
Joseph, Dimitri and Verinda were interested to know whether students who worked are more likely to own a smartphone so they each surveyed members of their class.
Joseph, Dimitri and Verinda were interested to know whether students who worked are more likely to own a smartphone so they each surveyed members of their class.
Based on the Venn diagrams they drew, complete a two-way table for each of their classes.
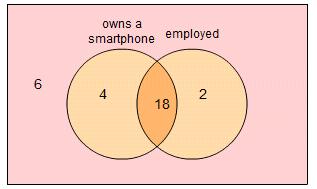
Joseph drew this Venn diagram after surveying his class.

Create and fill in a two-way table to accurately reflect the data in Joseph’s Venn diagram.
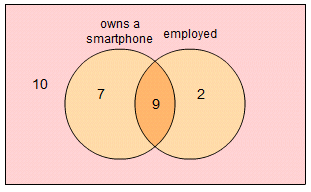
Dimitri drew this Venn diagram after surveying his class.

Create and fill in a two-way table to accurately reflect the data in Dimitri’s Venn diagram.
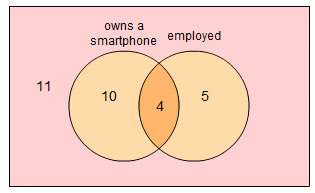
Verinda drew this Venn diagram after surveying his class.

Create and fill in a two-way table to accurately reflect the data in Verinda’s Venn diagram.
Survey your class and draw a Venn diagram similar to Joseph’s, Dimitri’s and Verinda’s diagrams. Use an online tool, Microsoft Word, or pen and paper. Additionally, construct a two-way table displaying the results of your survey.
Joseph, Dimitri and Verinda were wondering whether students who have a job are more likely to own a smartphone.
Which of their Venn diagrams support this hypothesis?
Which Venn diagram did not support this hypothesis?
Does your own Venn diagram support this hypothesis?
© State of NSW, Department of Education, 2018